What Is Item 19 and Why It Matters
Why Item 19 Deserves Your Attention
When evaluating franchise opportunities, nothing cuts through the sales pitch like hard numbers. That's where Item 19 comes in. This is where a franchisor can choose to share financial performance information about its existing locations.
Why does this matter? Because buying a franchise is a major investment. You need more than sales pitches and promises. You need real numbers that show potential earnings, reveal costs and highlight possible risks. Item 19 is often the closest you'll get to seeing how franchises are actually performing, which makes it a critical tool for your research.
Why Item 19 Is So Important
Franchisors aren't obligated to provide Item 19 data, but many include it because buyers want transparency. When it's there, you get a better sense of how their locations perform day to day.
Here's what makes it so valuable:
- Sets realistic expectations
Often you can see what top, average and lower-performing locations actually earn.
- Helps you compare brands
If you're choosing between franchises, Item 19 data can help you weigh potential returns.
- Guides your due diligence
You'll know what questions to ask when talking to current franchisees or the franchisor.
- Highlights hidden risks
Averages alone can be misleading, but detailed breakdowns reveal performance gaps you need to consider.
Item 19 goes beyond the numbers. It can help you set expectations and see whether the brand fits your financial goals.
Why Every Item 19 Looks Different
Item 19 is one of the least standardized parts of the FDD. That flexibility gives franchisors a lot of control over what they show and what they leave out.
Here are a few common approaches:
- No disclosure
: Some brands skip Item 19 entirely, leaving you with no financial data.
- Highlighting top performers
: Others show only their highest-earning locations, which can make the results look better than they really are.
- Gross revenue vs. owner earnings
: Some focus on total sales, while others share what owners actually take home after expenses.
- Performance segments
: Many brands group results into quartiles, such as top 50 vs. bottom 50 or other categories.
- Regional breakdowns
: Some brands separate results by geographic area, giving insights into market-specific strengths and weaknesses.
- Performance by years in business
: Some franchisors show results based on how long a location has been operating. This can be especially helpful for understanding how a store might perform in its first year compared to its fifth.
Because the presentation varies so much, it's important to read Item 19 closely and understand how the numbers are calculated. Two brands might both list an "average annual revenue," but if one includes every location and the other only the top 25 percent, those averages tell very different stories.
How to Interpret Item 19 Data
To make sense of Item 19, you have to look beyond one figure. Focus on what's included, what's left out and how the information fits your situation.
- Start with the sample size
How many locations are included? Are the numbers based on every franchise or just a subset?
- Look for quartiles or ranges
Breakdowns by quartile or segment show you the spread between top and bottom performers. This is key to setting realistic expectations.
- Pay attention to regional differences
A franchise might perform well in some markets and struggle in others. If there's a regional breakdown, use it to gauge how the brand does in areas similar to yours.
- Check what's measured
Is the data based on gross sales, net profit or owner earnings? Each tells a different story about potential returns.
- Use Item 19 as a springboard
The data should guide your next steps: talking to current franchisees, comparing brands and stress-testing your assumptions.
Real Example: Culver's Item 19
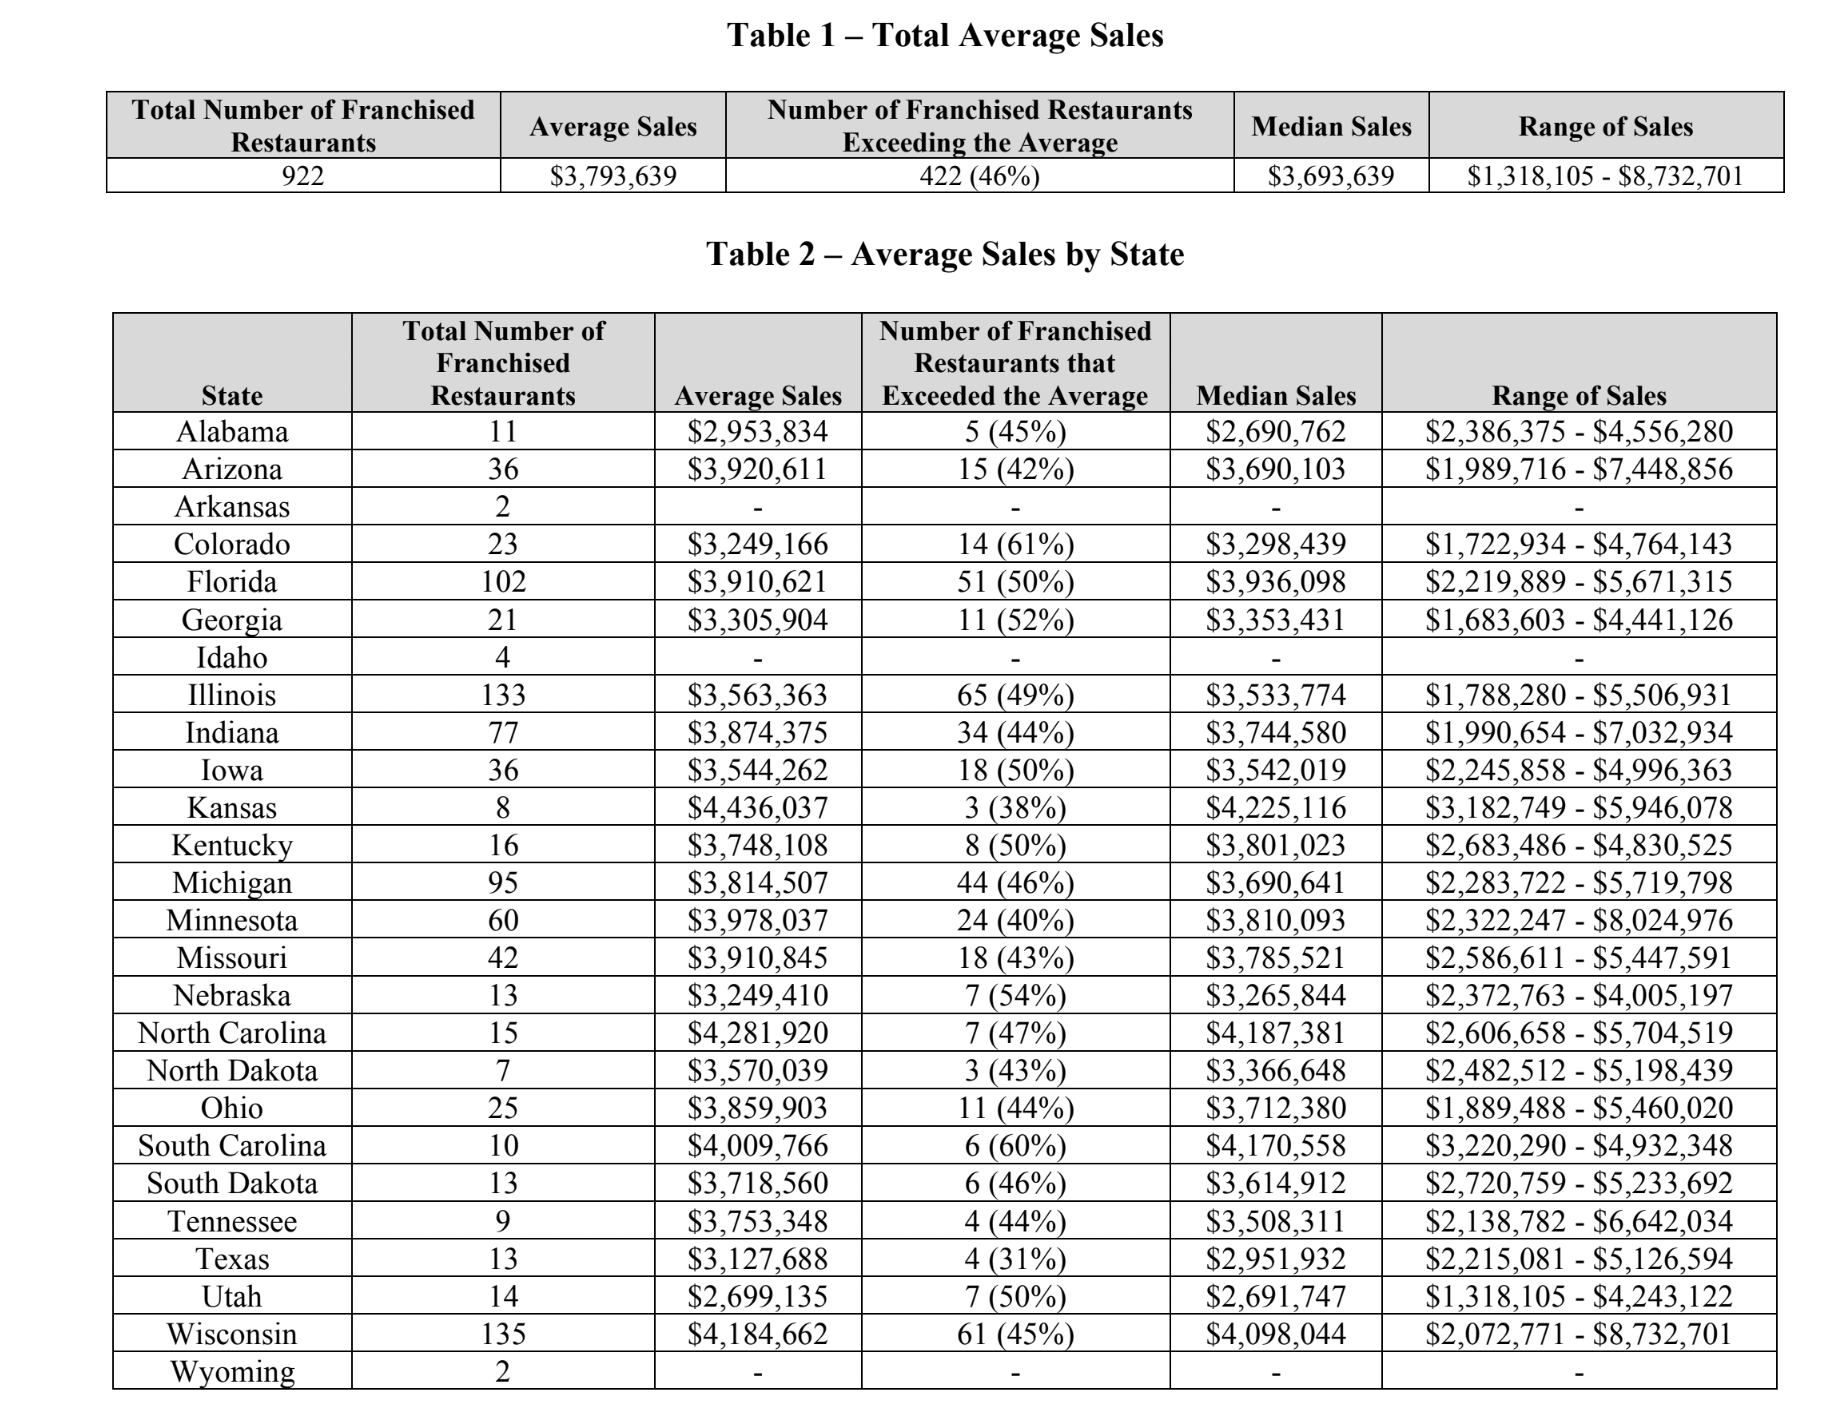
Culver's provides a detailed Item 19 disclosure in its FDD. In the 2024 filing, they break down average annual sales across 922 franchised restaurants and even provide a state-by-state view.
What stands out immediately is how much performance varies depending on location:
In Kansas, the average annual sales are over $4.43 million, while North Carolina comes in close at $4.28 million. States like South Carolina and Wisconsin also show strong averages, both exceeding $4 million. Meanwhile, locations in states such as Texas and Utah report significantly lower averages, around $2.95 million and $2.69 million respectively.
This variation shows why regional performance is critical when evaluating a franchise. If you live in a state where Culver's performs well, your potential upside may be higher than the system-wide average. Conversely, opening in a weaker market could mean facing tougher conditions.
Another thing to notice is that some states, like Arkansas and Idaho, don't report data at all. That doesn't necessarily mean those markets are poor choices, but it's a signal that you should ask questions during your due diligence. Are there too few stores to report? Is performance inconsistent?
This is why a detailed Item 19 can be so valuable. It gives you more than a single system-wide average and helps you evaluate how a brand performs in regions that matter to you.
Final Thoughts
Item 19 is more than a simple chart in the Franchise Disclosure Document. It is your window into how a brand's locations are actually performing and where you might fit within that picture. The more detail a franchisor provides, the better equipped you are to make an informed decision.
Before you commit to any opportunity, compare multiple FDDs, review Item 19 data closely and speak with current franchisees. Use the numbers to guide your questions and challenge your assumptions.
Item 19 is not the entire story, but it is one of the most powerful tools you have when evaluating a franchise. Treat it as the starting point for deeper research and a way to match your goals with the right brand.
About the Author
A Trusted Industry Leader Since 1995. Founded in 1995, Franchise.com was one of the first franchise recruitment websites in the world. Today, we continue to be the 'go to' place for people beginning their business opportunity search and the journey of franchise ownership as well as for those already involved in the world of franchising.Categorized Under: Franchise Information
Other Franchises Looking For Owners Like You
Not sure which franchise fits you best? Start Here